Extracting Intersection Light Timing from Flow Data

Summary:
Video-based flow tracking is used to compute intersection light period by finding peaks in the Fourier transform of the flow signal. Flow is calculated by tracking moving objects at an intersection using VTC.
Setup
Flow measurements for this study were collected at the intersection of Hurontario St & Absolute Ave in Mississauga, ON. Video footage was recorded using a Logitech 9000 webcam and processed on a Windows 10 desktop with an Intel i5 CPU.
This video demonstrates a good camera mounting position; very high overhead view with few obstructions. The intersection is a T with the major road being Hurontario and the minor road being Absolute Ave. VTC software was configured with a ROI covering the bulk of the intersection. Turn events were not collected for this study.
VTC periodically outputs the instantaneous intersection state (a list of tracked object, including velocity). In this case, intersection state was logged every 2s. Video was processed after recording. A ~17 minute video was processed to yield 510 flow samples at a rate of 0.5 Hz.
Processing Data
Intersection state is logged every 2s in the following format :
2015-03-30T09:28:26-04:00 [ (x:89.7m,y:21.9m,vx:-2km/h,vy:6km/h,R:117,G:117,B:107,type:Unknown) (x:83.4m,y:29.2m,vx:0km/h,vy:0km/h,R:112,G:111,B:102,type:Unknown)]Download logs
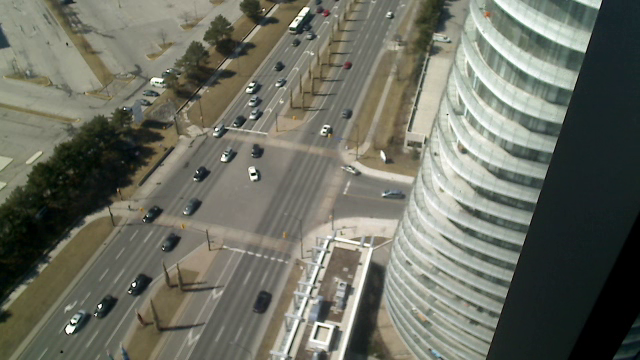
Each measurement (line) contains readings for every object currently tracked. The total flow for a single timestep is given by:
∑√(vxi2 + vyi2 )i=1:N where N: the number of tracked objectsThe FFT is computed for the flow timeseries:
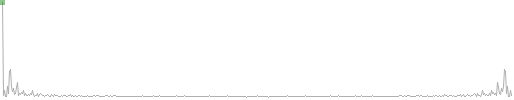
Notice that the peak value is DC (ƒ = 0). After eliminating the DC term and frequencies above 2.5Hz, we see the interesting part of the FFT:
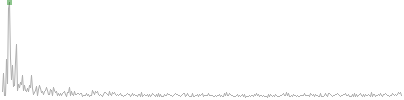
The peak of the FFT (after removing DC) is located at array element 9. The relationship between FFT index ω and frequency ƒ is given by:
ƒ = ω * ƒs / Ns where Ns: total number of samples, ƒs: sampling frequencyƒ = 9 * 0.5 / 510 = 0.0088
T = 1/ƒ ~= 113s
Thus the intersection light period is approximately 113 seconds and each phase is approximately 56 seconds.
Results
Based on manual analysis, the actual intersection light period is close to 55 seconds yielding an error of 1 second. This is equivalent to an accuracy of +/-1 unit of the FFT axis. A longer sampling time would achieve a higher-resolution estimate of the low-frequency light timing.
Software
This study was done with VTC car-counting software. See roadometry.com for a free trial. Write us at alex@roadometry.com with questions.
Additionally, this study made use of:- the spark_pr ruby module for generating sparklines
- ruby language for processing text files
- MATLAB for calculating FFT